Environment
How our climate changed in 2016

Image: nesrin ozdemir/Shutterstock
This year saw some of the most intense climate changes in recorded history. Despite the waning effects of El Niño, global temperatures continued to rise and the ice levels of the Arctic steadily dwindled. And because most scientists agree that manmade global warming exists, collecting yearly data is extremely important. Here’s how our climate changed in 2016.
Global Surface Temperatures
One way our climate changed in 2016 was by unprecedented rises in global temperatures. The average global temperature is considered by scientists to be the clearest indicator of climate change, so keeping tabs on the numbers is essential. According to the National Oceanic and Atmospheric Administration, September ended a 16 month-long record of high temperatures. That means the previous sixteen consecutive months all reached the highest temperatures in recorded history. And finally, that sixteen-month streak in turn beat the record for consecutive hottest months. September’s temperature was just below that of September 2015, breaking the cycle.
Atmospheric Carbon Dioxide Levels
The global earth temperature is affected by human activities like burning fossil fuels. The burning process of oil and coal produce carbon dioxide (CO2) that enters the atmosphere, but can’t break the barriers of our natural greenhouse. As levels of atmospheric CO2 rise, so do global temperatures.
September 2016 saw an historic and devastating mark in the fight against global warming. The levels of atmospheric carbon dioxide, measured in parts per million (PPM), reached a permanent level above 400. While scientists agree that certain days in the future might measure lower than 400PPM, the monthly average will never fall below the mark. Gavin Schmidt, NASA’s chief climate scientists, said in an email to LiveScience, “In my opinion, we won’t ever see a month below 400 ppm.”
Of course, the unparalleled atmospheric CO2 levels have in turn created record-breaking global temperatures.
Arctic Sea Ice Extent
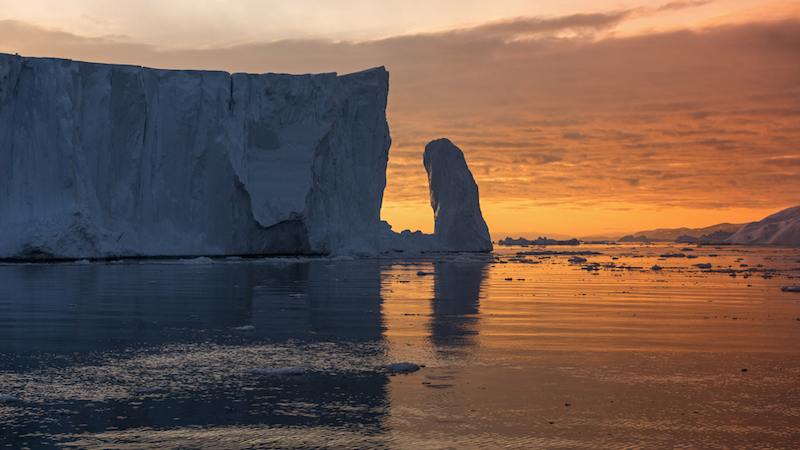
Another indication of climate change is the measurement of the Arctic Sea Ice Extent. LiveScience reports that the ice levels of the Arctic and Greenland Ice Sheet are the lowest they’ve ever been, which has a multitude of repercussions: coastal cities are under threat of flooding as Arctic ice breaks off and eventually melts; precious ecosystems are irreparably damaged as water temperatures change and habitats float away; predictable jet-streams turn deadly as rising temperatures cause anomalies.
Antarctic Ice Sheet
The Antarctic Ice Sheet isn’t safe from global warming, either. In a new study published by LiveScience, it appears that the supermassive ice sheet is breaking off from the inside out. After a 20-mile rift occurred in 2015, satellite images collected in prior years proved that the rift spread upwards from the base.
Dubbed the Pine Island Glacier, the unconventional rift proves that the Antarctic Ice Sheet is indeed melting. Ian Howat, a glaciologist from Ohio State University commented, “It’s generally accepted that it’s no longer a question of whether the West Antarctic Ice Sheet will melt — it’s a question of when.”


0 comments